Jordan Rollover System Dynamic Rollover Testing (JRS)
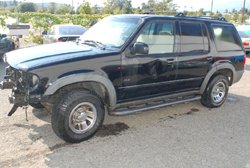
2000 Ford Explorer SUV
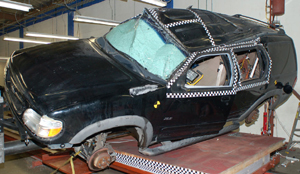
Explorer Roof Strength is Weak in JRS Rollover Testing
On October 3rd, 2006 we tested this Ford Explorer to determine how the roof would perform in a dynamic rollover event on the JRS. The results were that the Explorer was much weaker than the Volvo XC90 we tested and is not optimal for protecting occupants in rollover events.
Please contact us if you're interested in obtaining this testing. |
 |
The measurements now collected from the JRS provide some of the world’s first, most comprehensive direct measurements of roof structure deformation and intrusion velocity. Both of these parameters are directly related to the risk of serious head and neck injury. |
|
|
2000 Ford Explorer - Post Test 1 |
2000 Ford Explorer - Post Test 2 |
Test Vehicle Information: |
Manufacturer: Ford Motor Company |
VIN: 1FMZU72X1YUB59799 |
Gross Weight: 4,700 lbs |
Curb Weight: 4,146 lbs |
Sunroof: No |
2WD/4WD: 4WD |
Equivalent Years: 1995-2001 |
Body Type: 4 Door SUV |
Test Results:
The results of the first Dynamic Rollover Test that was performed on the test vehicle are presented in this section. In the test, the vehicle dropped as planned and contacted the front near and far sides of the roof structure.
Test 1 – 10/3/2006
Summary of Test Results
Instrument |
Peak Performance |
Residual
Intrusion (inches) |
Peak Intrusion Velocity (ft/s) |
Load Sum of Vertical Load Cells (near side) |
10,395 lbs |
|
|
Load Sum of Vertical Load Cells (far side) |
9,263 lbs |
|
|
Driver’s Side A-Pillar |
8.7 in |
5.9 |
9.3 |
Mid-Point between Driver’s Side A and B-Pillars |
9.1 in |
5.9 |
9.9 |
Driver’s Side B-Pillar |
6.7 in |
3.9 |
8.0 |
Header Inboard of A-Pillar |
7.0 in |
4.9 |
8.5 |
Roof Panel Inboard of the Roof Rail Midpoint |
11.5 in |
8.5 |
17.8 |
Roof Panel Inboard of B-Pillar |
8.7 in |
6.2 |
13.3 |
Center of Roof |
8.2 in |
6.3 |
11.1 |
Passenger’s Side A-Pillar |
4.2 in |
2.0 |
5.5 |
The vertical load cells mounted on the roadway platform show the near and far side impacts. The vehicle struck the roadway on the near side at approximately 1.67 seconds. The entire roll sequence was completed by approximately 2.09 seconds.
The string potentiometers located on the fixture support towers show the vertical vehicle motion throughout the test. The front of the vehicle dropped approximately 4.2 inches before contacting the roadway. The rear of the vehicle dropped approximately 5.4 inches before contacting the roadway. The vehicle was pitched at 4.6 degrees at contact.
The roll encoder located on the cable pulley shows the roadway velocity throughout the test. The roadway was traveling at 15.3 mph at contact. The roll encoder placed on the vehicle rotation shaft yields the vehicle roll angle during the test. The roll angle of the vehicle was 134 degrees at the roadway impact. The vehicle roll rate was obtained from the roll angle roll encoder. At initial contact, the vehicle roll rate was 200 degrees per second.
Test 2 – 10/3/2006
Summary of Test Results
Instrument |
Peak Performance |
Residual
Intrusion (inches) |
Peak Intrusion Velocity (ft/s) |
Load Sum of Vertical Load Cells (Near Side) |
7,046 lbs |
|
|
Load Sum of Vertical Load Cells (Far Side) |
14,251 lbs |
|
|
Driver’s Side A-Pillar |
9.2 in |
6.4 |
14.1 |
Mid-Point between Driver’s Side A and B-Pillars |
9.9 in |
7.0 |
13.7 |
Driver’s Side B-Pillar |
9.9 in |
6.7 |
12.9 |
Header Inboard of A-Pillar |
6.3 in |
4.2 |
10.3 |
Roof Panel Inboard of the Roof Rail Midpoint |
9.5 in |
6.0 |
14.5 |
Roof Panel Inboard of B-Pillar |
8.9 in |
5.6 |
11.9 |
Center of Roof |
5.7 in |
3.1 |
12.4 |
Passenger’s Side A-Pillar |
2.4 in |
-1.0 |
5.9 |
The vertical load cells mounted on the roadway platform show the near and far side impacts. The vehicle struck the roadway on the near side at approximately 1.72 seconds. The entire roll sequence was completed by approximately 2.11 seconds.
The string potentiometers located on the fixture support towers show the vertical vehicle motion throughout the test. The front of the vehicle dropped approximately 4.8 inches before contacting the roadway. The rear of the vehicle dropped approximately 5.6 inches before contacting the roadway. The vehicle was pitched at 4.8 degrees at contact.
The roll encoder located on the cable pulley shows the roadway velocity throughout the test. The roadway was traveling at 15.7 mph at contact. The roll encoder placed on the vehicle rotation shaft yields the vehicle roll angle during the test. The roll angle of the vehicle was 144 degrees at the roadway impact. The vehicle roll rate was obtained from the roll angle roll encoder. At initial contact, the vehicle roll rate was 188 degrees per second.
|


